
Lithium Battery Discharge Curves: Cell Consistency, Resistance, and Quality
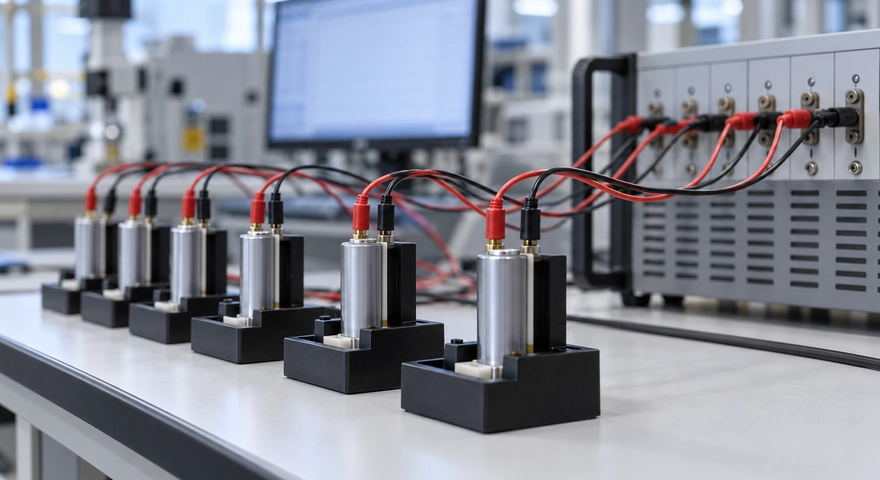
Commercial Summary: Himax Electronics presents this technical guide to support evidence-based battery evaluation. It outlines how discharge data can inform cell screening and custom pack design, while clarifying why test conditions and supporting measurements are essential to quality assessment.
Key Takeaways
-
A lithium battery discharge curve plots voltage against discharge time or delivered capacity. It can reveal voltage sag under load, the discharge plateau, usable capacity, and behavior near the end of discharge.
-
Before comparing cell consistency, align the chemistry, charging procedure, initial state of charge, temperature, discharge current, and cutoff conditions.
-
The voltage drop when a load is applied relates to resistance and polarization, but voltage differences across an entire curve cannot be converted directly into a fixed internal resistance.
-
Variation among multiple cells’ discharge curves can provide clues about capacity consistency, impedance differences, and batch stability.
-
Discharge curves support manufacturing quality assessment, but they cannot independently establish safety, long-term life, or a specific manufacturing defect.
-
Custom battery pack selection should consider curves under representative loads, temperature rise, pulse testing, and batch data rather than rated capacity alone.
Two lithium cells with the same rated capacity may deliver different runtimes or trigger low-voltage warnings at different points once installed in equipment. Some show little difference under light loads but develop greater voltage sag as the load increases. Others start at similar voltages but enter the end-of-discharge region earlier.
Lithium battery discharge curves often provide clues to these differences. For equipment manufacturers, purchasing teams, and battery developers, understanding the curves can help assess runtime, cell consistency, internal resistance, and manufacturing process stability. The key is to compare data under controlled conditions and distinguish a possible explanation from a verified cause.
How to Read a Lithium Battery Discharge Curve: Start with the Axes and Test Conditions
A typical lithium battery discharge curve shows voltage on the vertical axis and discharge time or delivered capacity on the horizontal axis. Each horizontal-axis format answers different questions.
| Curve Format | Primary Use | Interpretation Considerations |
| Voltage vs. time | Evaluate runtime and voltage behavior under a specified load | Runtime cannot be compared directly when discharge currents differ |
| Voltage vs. capacity | Compare plateau shape, delivered capacity, and the end-of-discharge region | Charging procedure, current, temperature, and cutoff voltage must be consistent |
| Voltage vs. normalized capacity | Compare curve shapes across cells | Normalizing each cell to its own capacity can conceal actual capacity differences |
| Pulse voltage response | Analyze voltage sag during loading and recovery after unloading | Sampling time, pulse duration, and initial conditions must be defined |
Also distinguish terminal voltage under load from open-circuit voltage. Voltage measured while equipment is operating is affected by current, resistance, and polarization. It is not the same as open-circuit voltage measured after sufficient rest.
Curve shape also varies by chemistry. Lithium iron phosphate cells typically have a relatively flat plateau, while some nickel-manganese-cobalt cells show a more pronounced voltage change as discharge progresses. A flatter curve does not, by itself, indicate better manufacturing quality.
How Do Discharge Curves Reflect Cell Consistency?
Cell consistency describes how closely cells match in capacity, impedance, self-discharge, state of charge, and other characteristics. Overlaying discharge curves from a single test reveals only part of that picture.
Similar Starting Voltages Do Not Establish Overall Consistency
Two cells can begin at similar voltages while differing in actual capacity, resistance, or aging. In chemistries with a relatively flat voltage plateau, a small voltage difference does not necessarily indicate the same state of charge.
Cell matching should therefore include capacity, resistance measured under specified conditions, and self-discharge data rather than resting voltage alone.
Evaluate Plateau Voltage and End-of-Discharge Position Together
Under identical test conditions, a cell with a lower voltage plateau may have greater polarization, a lower initial state of charge, or a different temperature. If it also reaches the cutoff voltage earlier, it delivers less capacity under that test condition. Further testing is needed to distinguish a capacity limitation from early cutoff caused by voltage sag.
| Curve Behavior | Possible Explanations | Follow-Up Checks |
| Different starting voltages | Differences in initial state of charge, rest time, or self-discharge | Standardize charging and rest procedures; review storage records |
| Different voltage drops when load is applied | Differences in cell impedance, contact resistance, or temperature | Pulse testing, fixture inspection, and temperature measurement |
| Persistent deviation in the middle plateau | Differences in polarization, state of charge, or electrochemical characteristics | Low-rate retesting and impedance analysis |
| Earlier entry into the end-of-discharge region | Less usable capacity or earlier arrival at the cutoff condition | Low-rate capacity testing and initial-condition checks |
| Irregular voltage jumps | Poor contact, test equipment range switching, or protection activation | Raw current data, wiring inspection, and equipment logs |
A study published in Scientific Reports analyzed a large population of new cells and examined how cell-to-cell variation changed with discharge rate. Its findings show that consistency depends on the test rate: similar performance under a light load does not replace validation under higher loads. Reference: Rate dependence of cell-to-cell variations of lithium-ion cells
Total Pack Voltage Can Hide Individual Cell Differences
In a series-connected pack, one cell may reach its low-voltage protection threshold while the others still have charge remaining. This can limit the pack’s usable capacity.
Record individual cell voltages, current, and temperature alongside the pack discharge curve. Total voltage alone may not identify the cell that triggers an early shutdown.
What Is the Relationship Between Discharge Curves and Internal Resistance?
Resistance and Polarization Affect Voltage Under Load
The following simplified relationship helps explain discharge behavior:
Terminal voltage under load ≈ Open-circuit voltage at the current state − Ohmic voltage drop − Voltage loss due to polarization
The ohmic drop depends on current. Polarization includes electrochemical and transport processes operating over different timescales. Internal resistance should therefore not be treated as a single value that remains unchanged across temperature, state of charge, and load.
The same cell may produce different DC resistance results at low temperature, at a lower state of charge, or with a different pulse duration.
Estimating Resistance from Voltage Changes Requires a Defined Method
A typical pulse test changes the current under specified conditions and measures the voltage response at a defined time:
Effective DC resistance at the specified timescale ≈ Voltage decrease ÷ Current increase
For example, if a 5A increase in current produces a 0.10V drop at the specified sampling time, the corresponding effective resistance is approximately 20mΩ. That result applies to the test conditions used. Contact and measurement errors must be controlled, and the result should not be treated as the cell’s fixed resistance under every operating condition.
| Test Factor | Why It Affects the Result | Comparison Requirement |
| State of charge | Reaction and transport characteristics vary across the charge range | Use the same state of charge |
| Temperature | Affects ion transport and reaction kinetics | Align ambient and cell temperatures |
| Sampling time | Different measurement times include different polarization contributions | Specify the measurement time after the current change |
| Pulse current and duration | Affect voltage response, heating, and cell state | Use the same test procedure |
| Wiring and contact conditions | Fixtures and cables can introduce additional voltage drop | Use appropriate four-wire measurement and verify contact quality |
| Measurement method | AC impedance and DC pulse tests characterize different responses | Do not directly equate results from different methods |
Dividing the voltage difference between two cells at the same discharge time by the current does not establish their resistance difference. Their states of charge and open-circuit voltages may already differ.

How Do Discharge Curves Relate to Manufacturing Quality?
A discharge curve is one electrochemical expression of the manufacturing outcome. Material and process variation can affect capacity, polarization, and curve shape, but these relationships are generally not one-to-one.
| Manufacturing Stage | Characteristics It May Affect | Potential Clues in Discharge Data |
| Slurry mixing and coating | Active material distribution, coating loading, and conductive networks | Variation in capacity, plateau voltage, or rate performance |
| Calendering and pore structure control | Electrode contact and electrolyte transport | Differences in polarization under heavier loads |
| Electrolyte filling and wetting | Electrolyte distribution and electrode wetting | Higher impedance, unstable output, or abnormal rate performance |
| Tab and interconnect welding | Current paths and connection resistance | Greater voltage sag under load or abnormal localized heating |
| Formation and aging | Interface development and screening for abnormal cells | Shifts in capacity, impedance, or curves after storage |
| Environmental and contamination control | Side reactions, self-discharge, and long-term stability | Some issues may emerge after storage or cycling |
These observations suggest investigation paths rather than confirmed diagnoses. Excessive voltage sag, for example, may result from internal connections, low temperature, aging, or poor external fixture contact. A discharge curve alone cannot establish a welding defect.
Manufacturing quality assessment should also include batch statistics and process traceability. For the same model under the same test conditions, stable distributions of capacity, energy, voltage at specified capacity points, and pulse resistance are more informative than a single smooth curve.
Even closely overlapping curves cannot rule out latent internal defects or establish compliance with all applicable safety requirements.
How Do You Build a Meaningful Discharge Test?
Standardize the Test Conditions
Define the model, chemistry, cycling history, charging procedure, rest time, temperature, and cutoff conditions before testing. New and previously used cells should not be pooled to evaluate manufacturing consistency.
For cells with the same rated model, also specify whether testing uses the same absolute current or a C-rate calculated from a common capacity reference. This avoids introducing differences through inconsistent test currents.
Evaluate Capacity, Energy, and Representative Loads
Similar delivered capacity does not mean identical delivered energy. A cell operating at a lower voltage throughout discharge may deliver less energy even if its amp-hour output is similar.
For motor-driven equipment, communications modules, medical devices, and other applications, select pulse, constant-power, or dynamic-load tests that reflect actual use. Passing a low-rate laboratory capacity test does not establish that voltage sag and runtime will meet the equipment’s requirements.

Retain Raw Data and Analyze Batches
Record voltage, current, temperature, and time together. Depending on the application, evaluate capacity spread, energy spread, voltage differences within defined regions, and resistance distributions.
Incremental capacity analysis and differential voltage analysis can extract features that are difficult to identify in the original curves. However, these methods are sensitive to sampling accuracy, test rate, temperature, and data processing, so their interpretation requires defined limits.
Research on battery manufacturing process control has proposed using near-equilibrium voltage curves and differential voltage analysis to derive metrics related to electrode capacity and formation. These techniques can supplement routine capacity testing but require suitable models and validation. Reference: Differential voltage analysis for battery manufacturing process control
What Should You Ask a Custom Battery Pack Supplier?
| Information to Confirm | Why It Matters |
| Whether the curve represents an individual cell or a complete pack | Separates cell behavior from the effects of interconnects, protection electronics, and other pack components |
| Discharge mode and load level | Shows whether the test represents actual equipment operation |
| Charging procedure, temperature, and cutoff conditions | Establishes whether the data are comparable |
| Sample size and batch coverage | Avoids basing decisions on a single sample |
| Individual cell voltages, temperature rise, and protection records | Helps identify the factors limiting pack performance |
| Initial performance and results after cycling or storage | Shows how consistency changes with use and time |
For custom projects, acceptance criteria should reflect equipment requirements. Low-voltage warning thresholds, load pulse duration, and operating temperature range can all affect compatibility. A single voltage-spread or resistance-spread limit should not be applied indiscriminately across different projects.
Lithium Battery Discharge Curve FAQ
Does a Flatter Discharge Curve Mean Better Battery Quality?
No. Curve shape depends primarily on chemistry and is also affected by discharge rate, temperature, and test conditions. Compare similar products under equivalent conditions, using capacity, energy, impedance, temperature rise, and batch stability as supporting evidence.
Why Do Two Cells with the Same Capacity Have Different Discharge Curves?
Capacity is only one metric. Resistance, polarization, initial state of charge, temperature, and aging can change the curve. Even cells with similar amp-hour output may differ in voltage under load and delivered energy.
Can Internal Resistance Be Calculated Directly from a Standard Constant-Current Discharge Curve?
A standard curve generally does not provide a clearly defined resistance value by itself. Open-circuit voltage and polarization change during discharge. Compare DC resistance using a method that specifies state of charge, temperature, pulse current, and sampling time.
Do Similar Voltages Mean Similar States of Charge in Lithium Iron Phosphate Cells?
Not necessarily. Lithium iron phosphate cells have a relatively flat middle plateau. The voltage-to-charge relationship is also affected by temperature, rest conditions, and hysteresis. A small voltage difference alone does not establish matching states of charge.
Does an Earlier End-of-Discharge Drop Indicate a Manufacturing Defect?
Not necessarily. Possible causes include capacity differences, insufficient initial charge, low temperature, higher discharge current, or cutoff conditions. First account for test conditions and usage history, then evaluate the product specifications and retest results.
Can BMS Balancing Resolve Every Cell Consistency Issue?
No. Balancing primarily adjusts differences in stored charge. It cannot restore lost capacity or eliminate high resistance or manufacturing defects. Cell matching and quality control remain important.
Can One Discharge Test Establish Battery Life?
No. A single test characterizes output at that time and under those conditions. Life assessment also requires cycling, storage, and relevant environmental testing, with clearly defined performance endpoints.

About Himax Electronics
Himax Electronics focuses on custom battery and power solutions for complex applications worldwide. The company also offers proprietary lithium-ion battery packs, power supplies, chargers, and accessories to meet industry-specific requirements. Each project calls for an assessment of load profiles, operating temperatures, available space, and charging conditions. Contact Himax Electronics to discuss cell configurations, protection strategies, and testing requirements that support compatibility between the battery and your equipment.