The global renewable energy industry is growing rapidly, and solar power plants are being developed in more regions around the world. As solar farms become larger and more advanced, construction teams face increasing challenges during installation, testing, and commissioning. One important challenge is providing reliable temporary power before the permanent electrical system is fully operational.
At HIMAX ELECTRONICS, we understand that solar farm construction requires not only high-quality photovoltaic equipment but also reliable supporting power solutions. During the installation and commissioning stages of solar tracking systems, workers often need temporary electricity to operate motors, control systems, testing equipment, and other electrical devices. Traditional power sources are often unavailable or inconvenient in large outdoor areas, making portable energy solutions increasingly important.
To solve this challenge, HIMAX ELECTRONICS has developed customized portable power solutions that provide safe, flexible, and reliable temporary power for solar farm construction and various outdoor operations. These portable power stations help improve installation efficiency, reduce downtime, and provide technicians with a convenient power source wherever it is needed.
Why Temporary Power Is Important During Solar Farm Construction
Solar farms are usually built in large open areas such as deserts, mountains, grasslands, and remote locations. During the early stages of construction, many supporting systems are not yet connected to the grid or permanent power supply.
However, construction teams still need electricity for many important tasks, including:
- Testing solar tracking motors
- Adjusting rotating bracket structures
- Operating control devices
- Checking electrical connections
- Running inspection equipment
- Supporting temporary lighting and communication systems
For solar tracking systems, accurate mechanical adjustment is especially important. Before the automatic tracking system begins operation, technicians must manually align motors and rotating structures to ensure that solar panels can follow the sun correctly.
Without a reliable temporary power supply, workers may need to use traditional generators. Although generators can provide power, they also have several disadvantages:
- High noise levels
- Fuel transportation requirements
- Regular maintenance requirements
- Environmental impact
- Limited flexibility in remote locations
Portable power stations provide a cleaner, quieter, and more convenient alternative.

How Portable Power Stations Support Solar Tracking System Installation
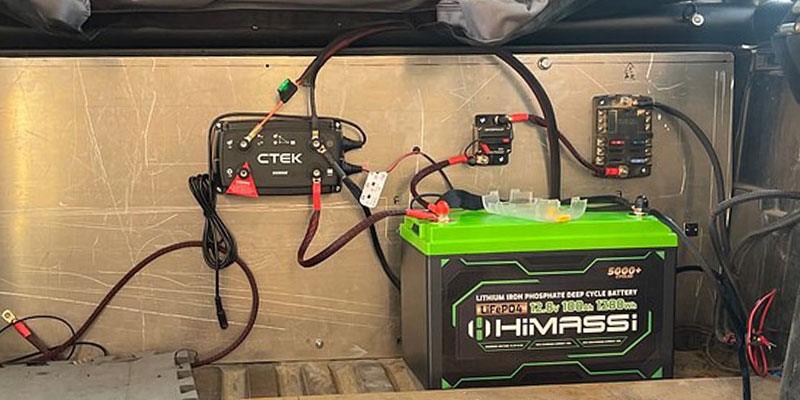
A portable power station is designed to provide temporary electricity during installation and commissioning.
Unlike permanent solar inverters or grid-connected energy systems, a portable power station is not intended to replace the main power infrastructure. Instead, it works as a flexible energy source that can be quickly moved and used wherever temporary power is required.
During solar tracking system installation, workers can connect the tracking motors and testing equipment directly to the portable power station. This allows technicians to complete alignment and debugging work even before the solar farm’s permanent electrical system is completed.
The main advantages include:
1. Easy Transportation and Installation
Large solar farms often cover hundreds or even thousands of acres.
Workers may need to move between different installation areas many times each day. Therefore, portability is a key requirement.
A well-designed portable power station should be:
- Lightweight
- Compact
- Easy to carry
- Simple to operate
This allows technicians to bring power directly to the working area without installing temporary cables across long distances.
2. Plug-and-Play Operation
Construction sites often involve multiple teams and different types of equipment.
A portable power station with a simple interface allows workers to quickly connect and disconnect devices without complicated installation procedures.
This improves working efficiency and reduces the time required for equipment preparation.
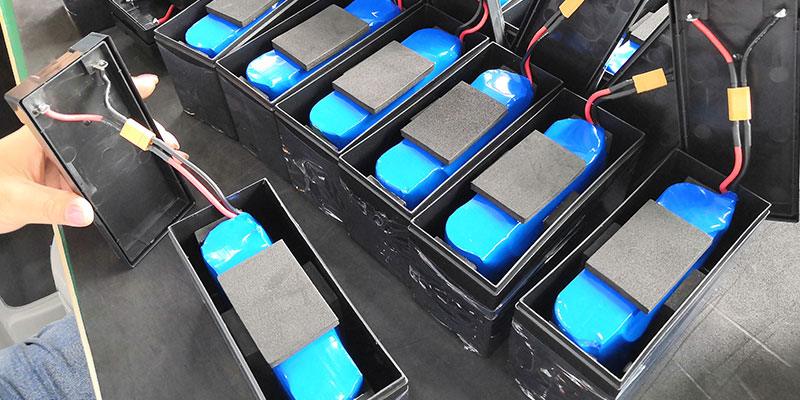
3. Reliable Outdoor Performance
Solar farm construction usually takes place in challenging environments.
The equipment may experience:
- Dust
- Rain
- High temperature
- Strong sunlight
- Uneven terrain
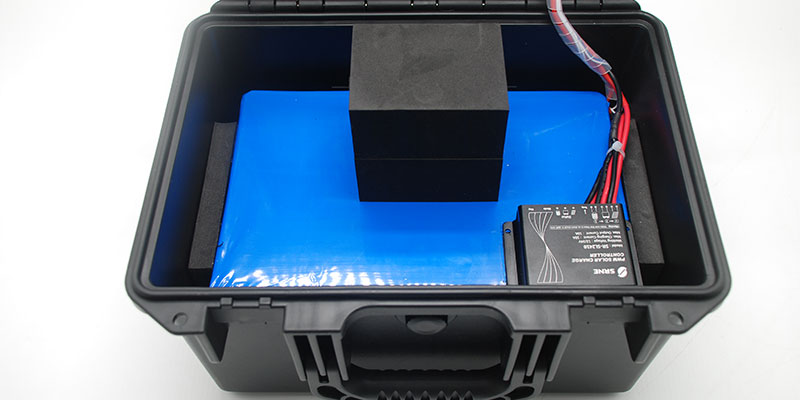
Therefore, portable power stations used for outdoor operations require durable designs.
Features such as waterproof and dustproof protection help ensure stable operation in changing weather conditions.
Smart Battery Monitoring Improves Construction Efficiency
One important feature of modern portable power stations is intelligent battery monitoring.
During outdoor operations, workers need to know the remaining battery capacity to avoid unexpected power interruptions.
A built-in monitoring system allows users to check important information such as:
- Remaining battery capacity
- Output power
- Charging status
- Operating conditions
This real-time information helps construction teams plan their work more efficiently.
For example, when aligning solar tracking motors, an unexpected power loss could interrupt the calibration process and delay the project schedule. With accurate battery monitoring, workers can recharge the system or prepare backup power before problems occur.
Portable Power Stations for Other Outdoor Applications
Although solar farm construction is an important application, portable power stations can support many other outdoor projects.
Their flexible design makes them suitable for various temporary power requirements.
Outdoor Security Systems
During the installation of solar farms, industrial sites, or construction projects, security cameras may need to operate before permanent electrical wiring is completed.
Portable power stations can provide temporary electricity for:
- Security cameras
- Monitoring equipment
- Communication devices
This allows security systems to become operational immediately during the construction phase.
Solar Street Light Testing
Before installing solar street lights in large quantities, engineers usually need to test lighting performance and control systems.
Portable power stations can provide convenient temporary power for:
- LED lighting systems
- Solar controller testing
- Installation verification
This helps engineers complete testing more efficiently.
Remote Construction Sites
Many outdoor projects are located far away from existing power infrastructure.
Portable power stations can provide temporary electricity for:
- Measurement instruments
- Testing equipment
- Small tools
- Emergency lighting
They are especially valuable in remote areas where traditional power solutions are difficult to access.
Technology Development of Portable Power Solutions
The portable power station industry continues to develop rapidly as demand for clean and flexible energy solutions increases.
Modern portable power stations are becoming more advanced through improvements in:
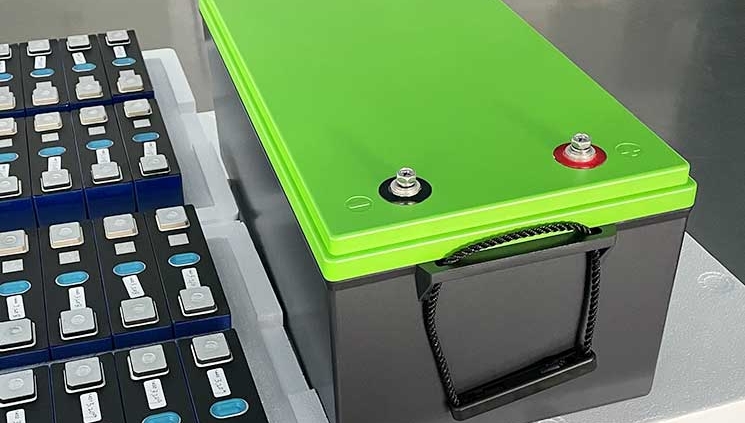
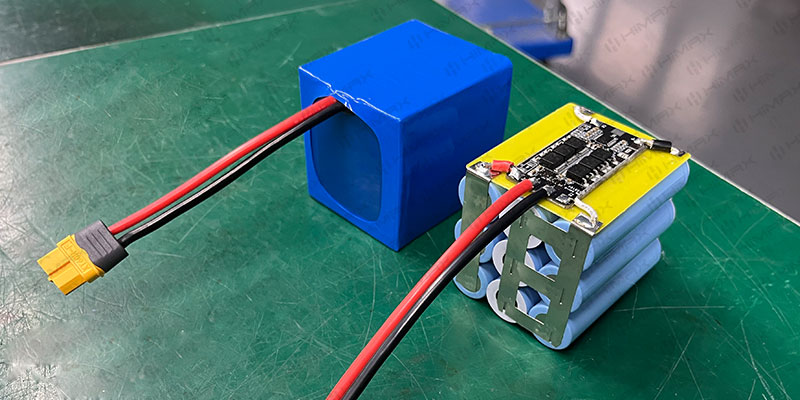
Battery Technology
Higher energy density battery cells allow portable systems to provide longer operating times while maintaining a compact size.
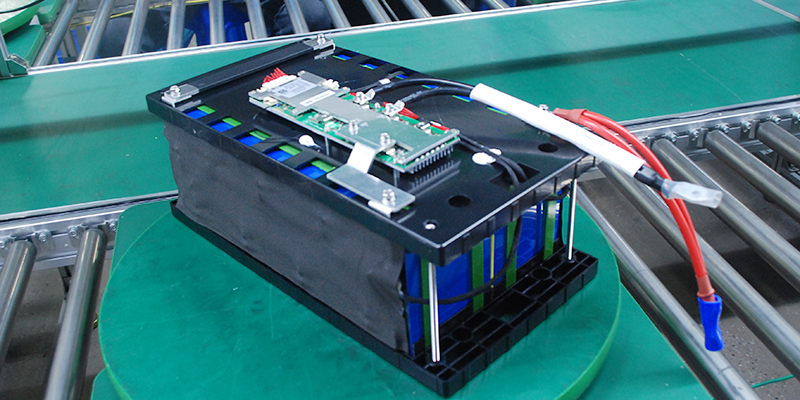
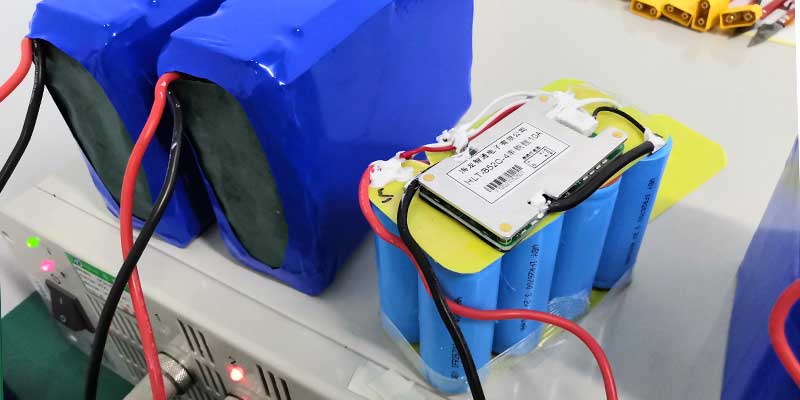
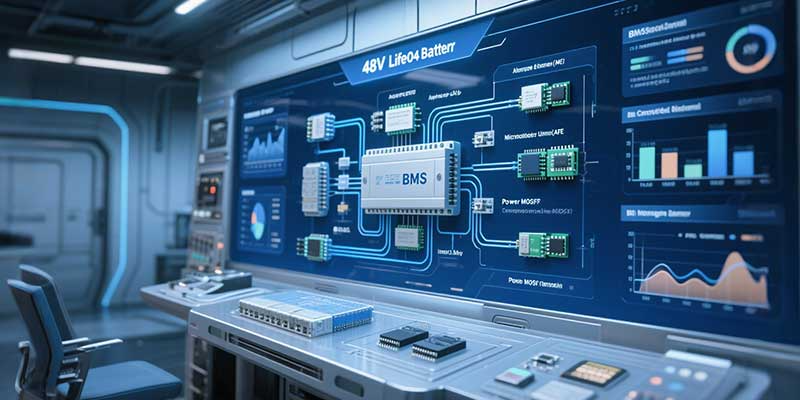
Battery Management Systems (BMS)
Advanced BMS technology improves:
- Battery safety
- Charging efficiency
- Temperature control
- Protection functions
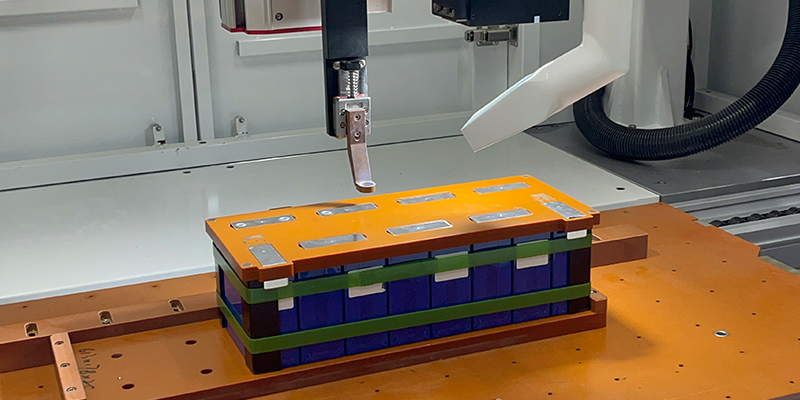
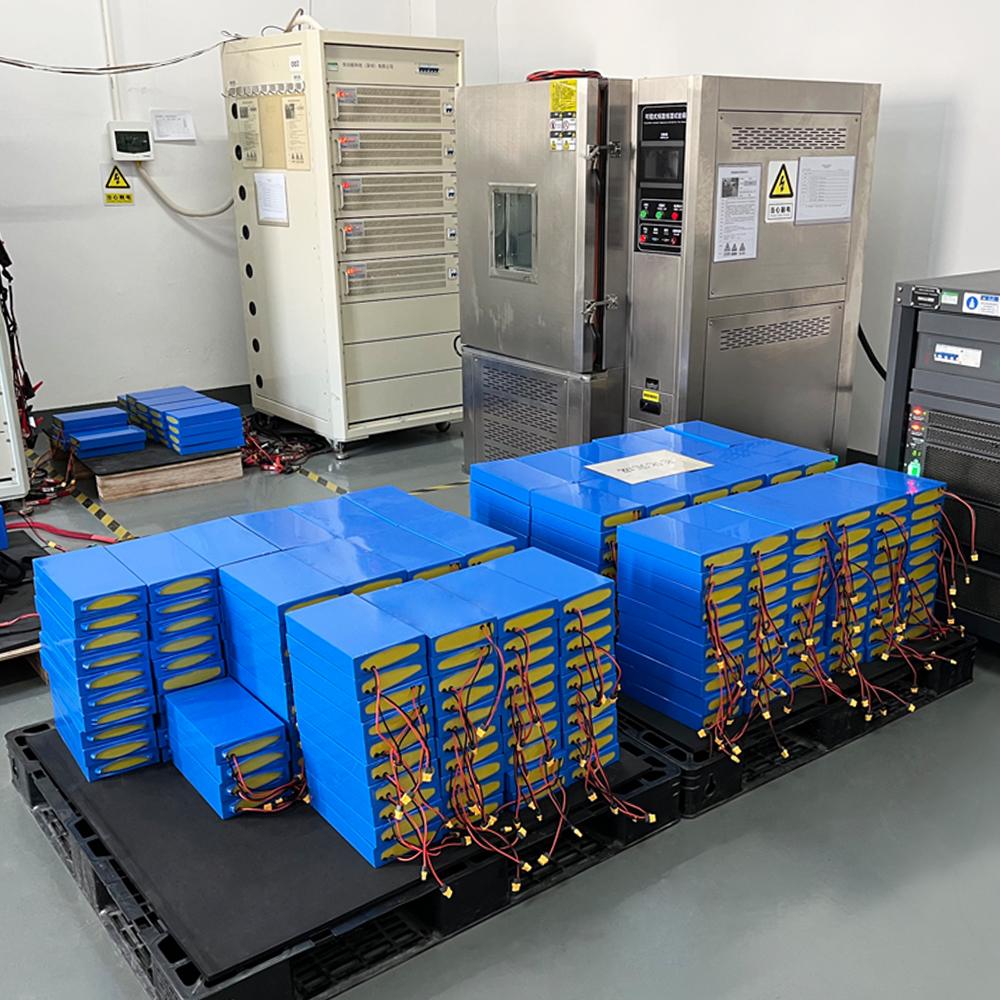
Thermal Management Design
Outdoor applications often expose equipment to extreme temperatures.
Effective thermal management helps maintain safe battery operation during heavy loads and hot environments.
Battery enclosure design, heat dissipation structures, and intelligent temperature monitoring all contribute to improved reliability.
How to Choose the Right Portable Power Station for Outdoor Applications
When selecting a portable power solution, users should consider several key factors:
Power Requirements
Different equipment requires different output power levels.
Before selecting a portable power station, users should evaluate:
- Equipment voltage
- Rated power
- Peak power requirements
- Operating duration
Battery Capacity
Battery capacity determines how long the equipment can operate.
A larger battery capacity provides longer working time but may increase the weight and size of the system.
Environmental Conditions
Outdoor applications require consideration of:
- Operating temperature
- Waterproof requirements
- Dust protection
- Transportation conditions
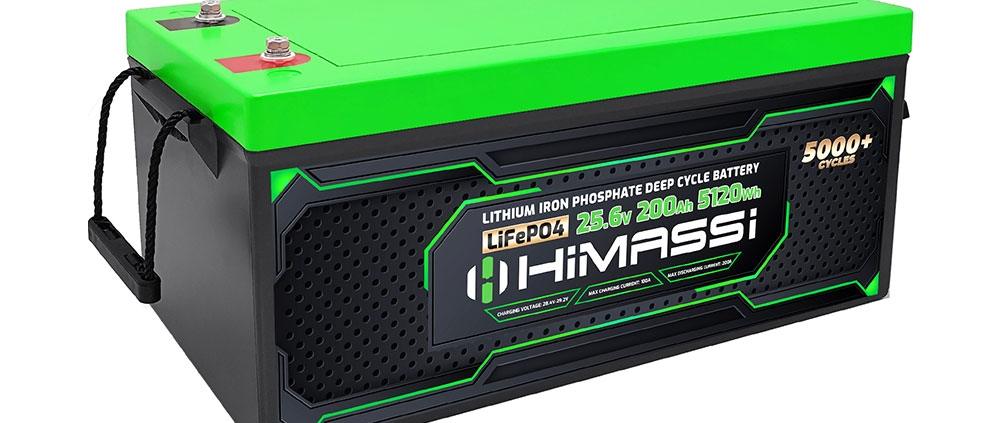
Safety Features
A reliable portable power station should include:
- Overcharge protection
- Over-discharge protection
- Over-current protection
- Short-circuit protection
- Temperature monitoring
These functions ensure safe and stable operation.
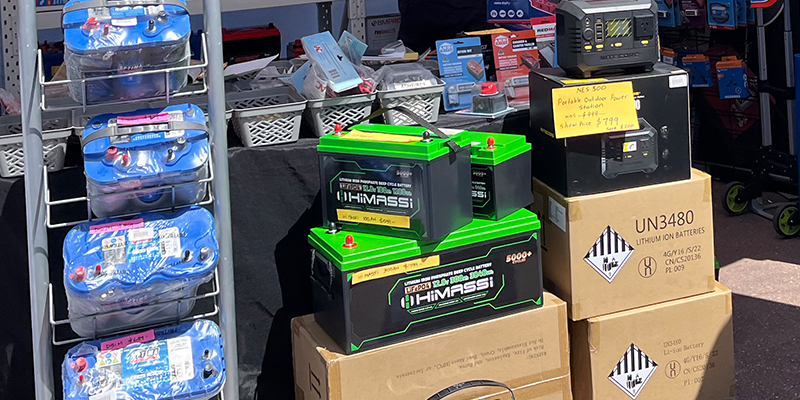
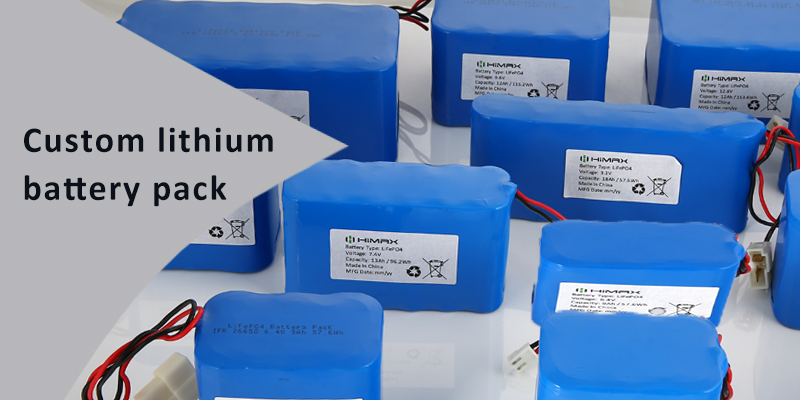
HIMAX ELECTRONICS Provides Customized Portable Power Solutions
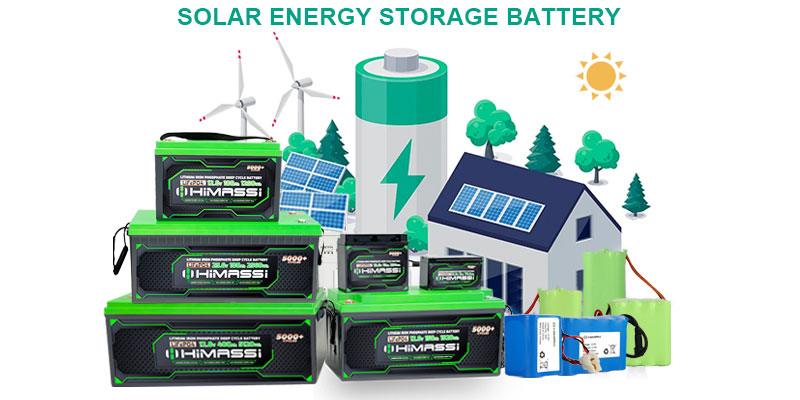
At HIMAX ELECTRONICS, we believe that the development of renewable energy requires not only advanced solar technologies but also reliable supporting power equipment.
Our customized battery solutions are designed to meet the practical needs of different industries, including solar energy, outdoor equipment, industrial applications, and emergency power systems.
From portable power stations for solar farm commissioning to customized battery packs for outdoor applications, our engineering team works closely with customers to develop solutions that match their specific requirements.
Conclusion
The growth of renewable energy has created new challenges for construction and outdoor operations. Solar farms, remote projects, and temporary installations all require flexible and reliable power sources during the early stages of development.
Portable power stations provide an efficient solution by offering mobility, safety, intelligent monitoring, and reliable energy supply. They help technicians complete installation tasks faster, reduce dependence on traditional generators, and improve overall project efficiency.
At HIMAX ELECTRONICS, we are committed to providing customized battery and portable power solutions that support the future of clean energy. Whether you need temporary power for solar tracking system installation, outdoor equipment testing, security monitoring, or remote construction projects, our team can provide a reliable solution tailored to your application.
Contact HIMAX ELECTRONICS today to explore how our portable power solutions can help improve your outdoor operations and keep your projects running efficiently.